
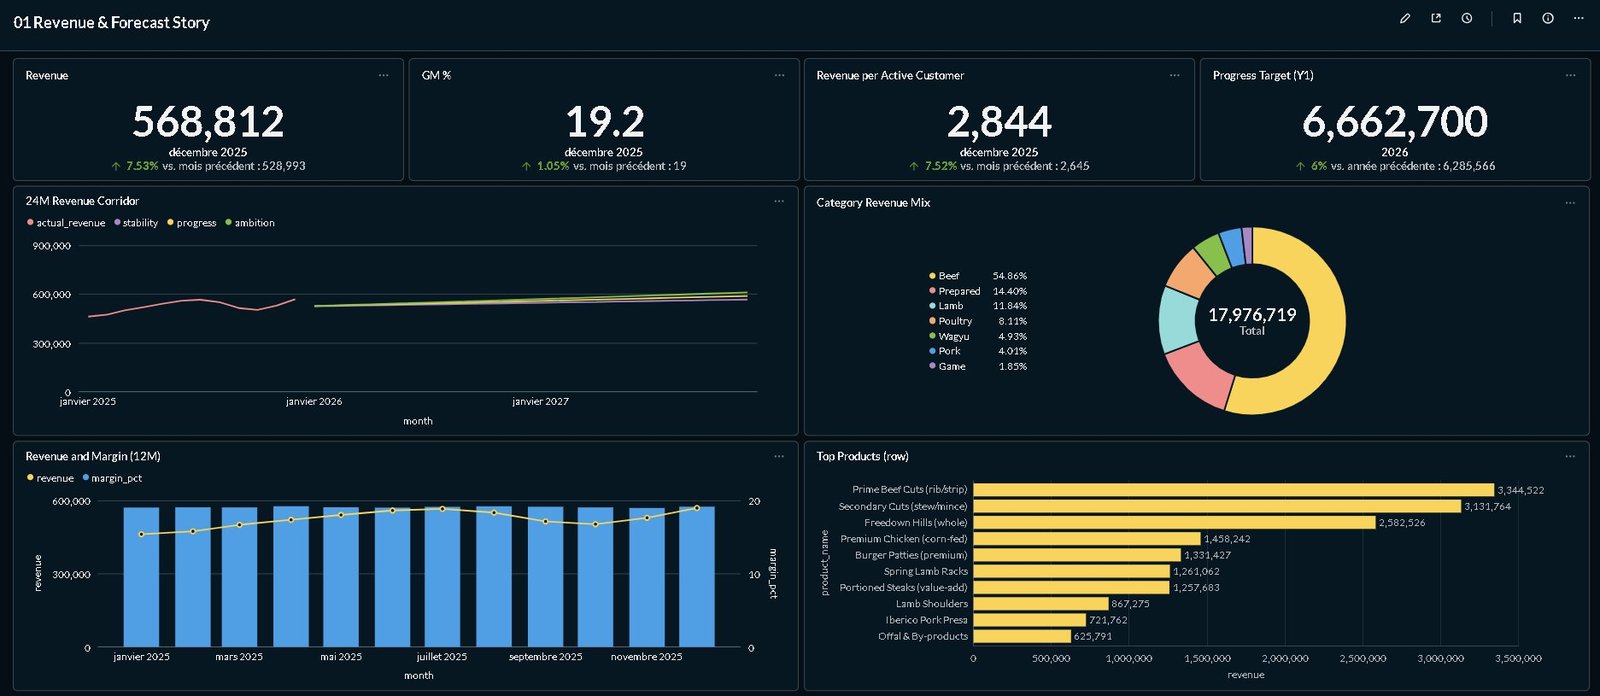
If you run an independent butcher shop, a meat distribution business, or a traditional delicatessen, you’ve probably noticed something: your net margin keeps shrinking even though revenue is holding up. The problem is almost never revenue. It’s what happens between buying the carcass and ringing up the sale — and it stays invisible without a dashboard.
This guide explains how to build a dashboard suited to an independent butcher shop or meat trading business: the 7 KPIs that actually matter, the data sources available from your ERP (Sage 50, EBP, Cegid, Mercatys, Polaris, and others common in the French market), and a real case study of hidden margin uncovered after three weeks of tracking.
The goal: give you a clear framework to know whether you’re making or losing money, business line by business line, month by month, without having to become a data analyst.
Why a butcher shop needs a dashboard in 2026
Traditional butchery is going through a period where instinct alone is no longer enough. Three structural forces are converging.
Price volatility. Pork prices have swung by more than 40% over two years. Beef, traditionally more stable, has seen 15-20% increases on certain cuts. A gross margin calculated mentally at time of purchase can collapse within weeks if selling prices aren’t adjusted.
Pressure on net margin. In the French market, the average net margin for an independent butcher shop sits between 4% and 8% depending on region and customer mix. At 5%, a simple 2-point drift in raw-material gross margin can push the year into the red without anyone seeing it coming.
Multichannel competition. Supermarkets, specialist chains, direct-from-producer sales, farm delivery boxes, subscription meat boxes — each one chips away at a slice of the market. A butcher who doesn’t know which customer segments (retail, restaurants, institutional catering, caterers) are actually profitable, which aren’t anymore, and which are shifting, is flying blind.
On top of this sit operational constraints that quietly erode margin: energy costs for cold storage, the cost of skilled labor (a trained butcher is hard to find), and traceability and food-safety compliance requirements that eat into administrative time.
In this context, a dashboard isn’t a digitization gadget. It’s the tool that turns the feeling that “things aren’t going as well as before” into an operational diagnosis — and therefore into a decision.
The 7 essential KPIs for independent butcher shops
Not all KPIs are equal. An effective butcher shop dashboard narrows it down to seven, covering profitability, operations, and customers. Here they are, in order of importance.
1. Gross margin by product category
The foundational KPI. A butcher shop’s average gross margin blends together very different realities: premium beef can run at 38-42%, poultry at 28-32%, traditional charcuterie at 45-55%, ready-made dishes at 60-70%. Calculated globally, margin hides the categories that are drifting. Calculated by category, it reveals exactly where a price or mix adjustment is needed.
What to track: gross margin in % and in currency, by month and by category, with a year-over-year comparison.
2. Shrinkage rate
This is the percentage of material lost between buying the carcass and the final sale: bones, fat, trim, markdowns for expired sell-by dates, cutting errors. In a well-run shop, shrinkage sits around 12-18% depending on the cut. Above 22%, it’s a strong signal: either the raw material quality has slipped, the cutting process is suboptimal, or unsold stock is piling up.
What to track: shrinkage in % and in value, by category, monthly.
Many independent butchers have never measured their shrinkage precisely. Simply putting the number in front of them changes cutting behavior within a few weeks.
3. Average basket and customer frequency
Average basket size reveals how your shop is actually perceived by customers. If it drops while footfall stays flat, customers are still coming in but buying less — often a sign that prices have become a sticking point. If it rises while frequency drops, you have fewer customers, but better-targeted ones.
What to track: monthly average basket, number of transactions, frequency per identified customer (when you have a loyalty program or B2B accounts).
4. Top B2B customers and concentration risk
If you supply restaurants, institutional catering, or caterers, this KPI is critical. Many independent butchers discover that a single restaurant accounts for 30-40% of their B2B revenue without even realizing it. If that customer leaves, the following month is a disaster.
What to track: top 10 customers by revenue, % of total revenue, 3-month trend, alert if a single customer represents more than 15-20% of activity.
5. Seasonality and forecasting
Butchery is a strongly seasonal trade: Easter (lamb), summer (grilling, charcuterie), the autumn holidays, and year-end (festive poultry, foie gras, game). The gap between a normal month and December can reach +35% in revenue — but also costly stock mistakes if forecasting is off.
What to track: revenue and margin by month over a rolling 24 months, with year-over-year and two-year comparisons to spot trend breaks.
6. Stock rotation and sell-by-date risk
A cold room that turns over slowly is expensive: energy, tied-up cash, and markdown risk. Ideal rotation depends on the product (aged beef vs. dry-cured charcuterie), but tracking days-of-stock by category prevents unpleasant end-of-month surprises.
What to track: average days of stock by category, alert if sell-by date is under 3 days on a significant volume.
7. Raw material cost vs. average selling price
This KPI answers the question: “Are my price increases keeping up with my purchase costs?” When pork rises 8% but your selling prices only moved 3%, you’re eating your own margin without seeing it. Tracked month by month, this ratio is an early-warning signal.
What to track: raw-material cost index (base 100 on prior year), average selling-price index (base 100 on prior year), gap in points.
Where does the data come from?
A dashboard is only as good as its data sources. In independent butchery, the accessible sources are more numerous than you’d think.
The point-of-sale software / ERP is the primary source. Common French-market solutions — Sage 50, EBP, Cegid, Mercatys, Polaris, Boucher.com, Caisse Logiciel, Yokitup — all produce exports of sales, stock, and often theoretical margin. Export quality varies: some produce a clean monthly Excel file, others an unreadable PDF. Checking whether CSV export is available is an essential first step.
The connected scale (Bizerba, Avery Berkel, Mettler Toledo, Dibal) records weighings with a price per kilo, which lets you reconstruct the real margin at the level of the cut sold, not just at the ticket level.
Supplier delivery notes (from national meat processors, or local abattoirs) give exact purchase costs by category, essential for calculating gross margin.
Accounting exports (financial ledgers, purchase and sales journals) let you tie the dashboard back to actual accounting, and detect gaps between the theoretical margin from the POS system and the real margin reported by your accountant.
The practical challenge: these sources are rarely connected to each other. The independent butcher exports manually each month, re-keys everything into a spreadsheet, and eventually gives up for lack of time. That’s precisely the bottleneck that vertical SaaS tools are built to remove.
Three levels of dashboarding
When setting up a butcher shop dashboard, you’re really choosing between three levels of investment. None of them is a bad choice — they correspond to different stages of maturity.
Level 1: manual monthly spreadsheet. This is the starting point for most butchers. Advantage: zero software cost, full control. Drawback: it takes 3-5 hours a month when done rigorously, and rigor erodes fast. KPIs calculated by hand are rarely comparable month to month, and data-entry errors introduce noise that makes trends hard to read.
This level suits a shop that wants to test the idea without investing, or an owner with an accounting background. Beyond a few months, fatigue sets in.
Level 2: Power BI, Tableau, Looker Studio. General-purpose business intelligence tools. Powerful, but oversized for a small independent business. Connecting to a Sage 50 or EBP system typically requires a consultant, at a meaningful day rate, for several days of work, plus ongoing maintenance whenever the ERP changes. Entry cost: several thousand euros, plus a recurring licensing fee. Useful for a structured mid-sized business with a controller on staff. Disproportionate for an independent butcher.
Level 3: pre-configured vertical SaaS. Solutions built specifically for meat businesses, connecting to your ERP and delivering ready-to-use dashboards. Entry cost is nil or low (free trial), with a monthly subscription depending on the depth of analysis. This is the approach we take at Clairvia with our DG Cockpit pack for meat businesses, built for distributors and butchers.
The right choice depends on how much time you have (spreadsheet = a lot), your budget (general BI = high), and your in-house expertise (vertical SaaS = none required).
Case study: the invisible margin
A real, anonymized example from the French market. An independent butcher shop in the Paris region (Île-de-France), 4 employees, roughly €1.2M in annual revenue, split between retail (60%) and restaurant supply (40%).
Based on annual accounting, the owner believed his net margin was around 10-12%. When we connected his ERP (Sage 50) and cross-referenced it with his purchase invoices, the dashboard revealed two invisible drifts.
Underestimated shrinkage. The POS software calculated a theoretical gross margin from supplier purchase prices. But actual shrinkage (bones, fat, trim, markdowns) ran at 19% on beef, against an assumed 13%. On beef alone, that represented a gross margin loss of 6 points — roughly €14,000 a year going unaccounted for.
Forgotten customer discounts. The shop granted occasional discounts to its restaurant customers: 5% for an exceptional order volume, 8% for a loyal customer, sometimes 10% at month-end to hit targets. These discounts were entered at the till but never tracked. Cumulated over the year, they represented €22,000 in lost margin.
Total invisible loss: €36,000 a year, or 3 points of net margin. The real result wasn’t 10-12% — it was closer to 7-8%.
Detection took three weeks to set up. Fixes (revising beef cutting practices, capping B2B discounts with a minimum-margin threshold) were rolled out gradually over three months. By year-end, €28,000 in margin had been recovered — 23 times the cost of the dashboard.
This case isn’t exceptional. Across the butchers and distributors we work with, invisible margin generally sits between 2 and 5 points of net margin. It almost always hides in shrinkage, uncontrolled discounts, unsold stock, or a product mix that drifts without anyone noticing.
How to set up a dashboard in practice
Whatever level you choose, implementation follows the same five-step sequence.
Step 1: inventory your sources. List what your ERP produces (available exports, formats, frequency), your scale, your accounting. Identify the gaps: if your ERP doesn’t output margin by category, you’ll need to reconstruct it.
Step 2: choose 5-7 KPIs. Not 15. Not 20. Five to seven maximum, aligned with the priorities of your year. For a shop trying to fix its margin: gross margin by category, shrinkage, top customers, average basket. For a shop trying to grow B2B: top customers, concentration risk, B2B vs. retail margin, seasonality.
Step 3: set the frequency. Monthly for most KPIs. Weekly for stock rotation and sell-by-date alerts. Daily for high-volume shops with tight control over unsold stock.
Step 4: automate collection. This is the step that causes 80% of spreadsheet-based projects to be abandoned. Every hour spent manually re-keying numbers is an hour that won’t go toward analyzing them. An automatic connection to the ERP is the only durable way forward.
Step 5: build a reading ritual. A dashboard nobody looks at is useless. Block out 30 minutes a month, fixed on the calendar, to open the dashboard, compare against the prior year, and identify one concrete action to take before month-end.
Common mistakes to avoid
A few traps we see come up over and over.
Too many KPIs. A dashboard with 20 indicators doesn’t get read. Five to seven is enough.
No historical comparison. A single number says nothing. “Gross margin this month: 34%” means nothing without last month’s 36% and last year’s 35%.
Data not segmented. If you blend your retail and B2B activity into a single average-basket figure, you get an average that reflects neither reality.
No automatic refresh. A manually updated dashboard gets updated for the first two months, more rarely after that, and almost never after six months.
Confusing gross margin with net margin. Your POS software generally gives you a theoretical gross margin. Net margin is calculated by your accountant. Tracking one while believing you’re tracking the other leads to bad decisions.
Going further with augmented analytics
Beyond the descriptive dashboard (what happened last month), three more advanced levels of analysis are now within reach for small businesses.
Automatic anomaly detection. A system that alerts you when your beef margin drops below a 32% threshold, or when a major B2B customer hasn’t ordered in 6 weeks.
Recommendations. Based on historical data, identifying categories where a 3% price increase would be absorbed without volume loss, or unsold stock that could be repurposed into ready-made dishes.
Predictive analytics. Anticipating poultry demand for the holidays, the Easter lamb peak, or the summer dip on certain cuts.
These capabilities, long reserved for large groups, are now built into vertical SaaS tools and accessible to an independent butcher or meat distributor with no technical expertise. That’s the point of our Intelligence Layer at Clairvia: turning a descriptive dashboard into a tool for everyday decision-making.
In summary
Building a butcher shop dashboard in 2026 means:
Seven well-chosen KPIs (gross margin by category, shrinkage, average basket, top customers, seasonality, stock rotation, raw-material-cost-vs-selling-price index).
Three main data sources (ERP / POS software, connected scale, accounting exports).
Three levels of dashboarding depending on your maturity (manual spreadsheet, general-purpose BI, vertical SaaS).
A monthly 30-minute ritual to turn data into decisions.
Invisible margin exists in almost every butcher shop. Finding it doesn’t require a massive project. It requires a dashboard built for the trade, connected to your sources, and read regularly.
Want to see what a pre-configured butcher shop dashboard looks like on your own data? Request a demo of Clairvia — we connect to your Sage 50, EBP, or Cegid system in under an hour and show you your real KPIs over three months of history. No commitment, no installation on your end.
Frequently asked questions
What does a dashboard cost for an independent butcher shop?
Three ranges depending on the approach. Manual spreadsheet: €0 in software, but 3-5 hours a month of in-house labor. Power BI / Tableau with a consultant: several thousand euros to set up, plus a recurring monthly license fee. Pre-configured vertical SaaS: a monthly subscription with no setup fee when the ERP is a standard one.
How long does it take to set up a dashboard?
For a vertical SaaS connected to a standard ERP (Sage 50, EBP, Cegid), expect half a day of technical setup, and three weeks to get familiar with it and spot the first drifts. For an Excel or general BI project, the timeline runs into months and depends heavily on in-house skills.
My ERP doesn’t have an export function. What do I do?
Most trade-specific ERPs (Sage 50, EBP, Cegid, Mercatys, Polaris) have CSV or XML exports, sometimes buried in the menus. If your system is genuinely closed, third-party bridges or connected-scale scraping solutions exist. This is a point worth validating before choosing any tool.
Is the gross margin shown by my POS software reliable?
It’s theoretical: it compares the selling price to the recorded purchase price, without accounting for actual shrinkage, unsold stock, or discounts that weren’t logged. It’s a decent trend indicator, but real margin is generally 3 to 8 points lower. A properly built dashboard reconstructs real margin by cross-referencing sales, purchases, and measured shrinkage.
Do I need to be good with computers to use a butcher shop dashboard?
No, as long as you choose a solution built for the trade. A vertical SaaS delivers ready-to-use dashboards: getting up to speed takes 1-2 hours of training, no more. The skill required isn’t technical — it’s knowing what to look for in the numbers.
Written by Cédric Beaujon, founder of Clairvia. Clairvia supports agri-food SMEs (butcher shops, meat distributors, food wholesalers) in the French market with pre-configured dashboards and a proprietary Intelligence Layer.