
Your figures say what’s happening inside the business; the market, what’s happening around it. Neither alone decides anything: beef at a high doesn’t say which customer is costing you margin; falling permits don’t say which 2027 project is at risk.
The VIL — Vertical Intelligence Layer — reads your industry’s market and crosses it with your data. That crossing is what unlocks your figures.
Two sources, one crossing
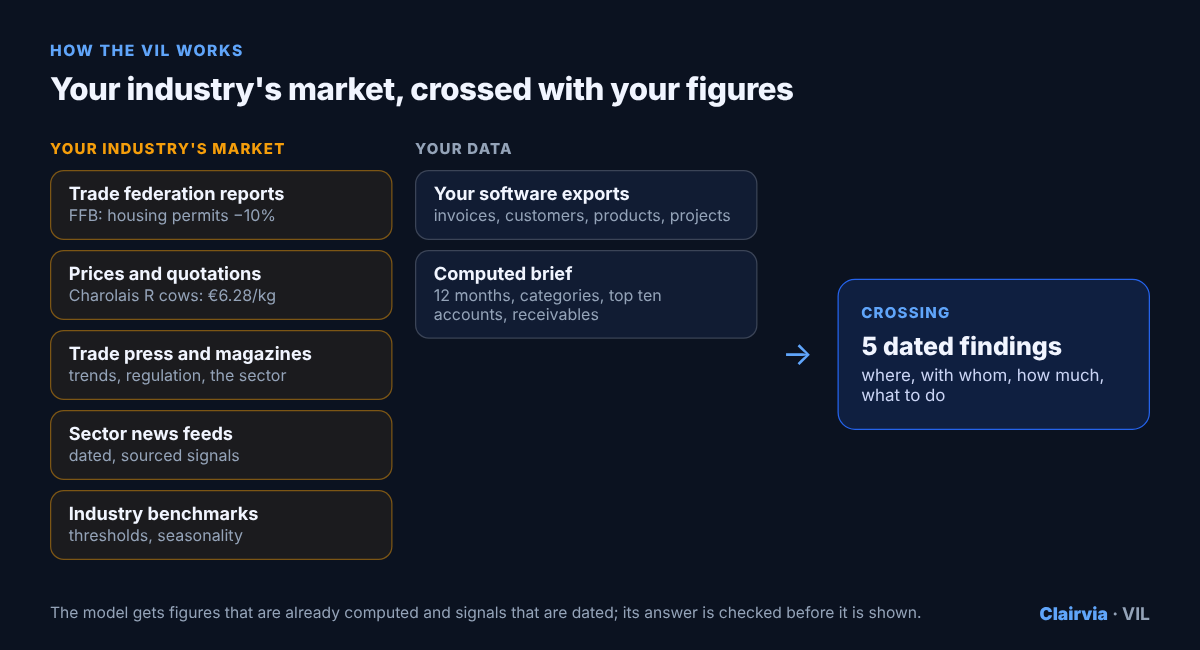
Dated, sourced market signals on one side; on the other, a brief the VIL computes from the company’s raw accounting or ERP exports. The crossing yields at most five dated findings, each saying where, with whom, how much, and what to do.
Two examples show how. The companies are fictional; the market signals are real, dated and sourced.
First example: a meat wholesaler facing beef at a high
Sixty-four customers — supermarkets, restaurants, butchers, caterers — six product categories, €2.07M of revenue over twelve months, a 24% margin.
The signal: in spring 2026, Charolais R cows were quoted at €6.28 per kilo of carcass weight, a high driven above all by a shortage of animals for slaughter. The wholesaler’s buying price rises; its selling prices don’t follow by themselves.
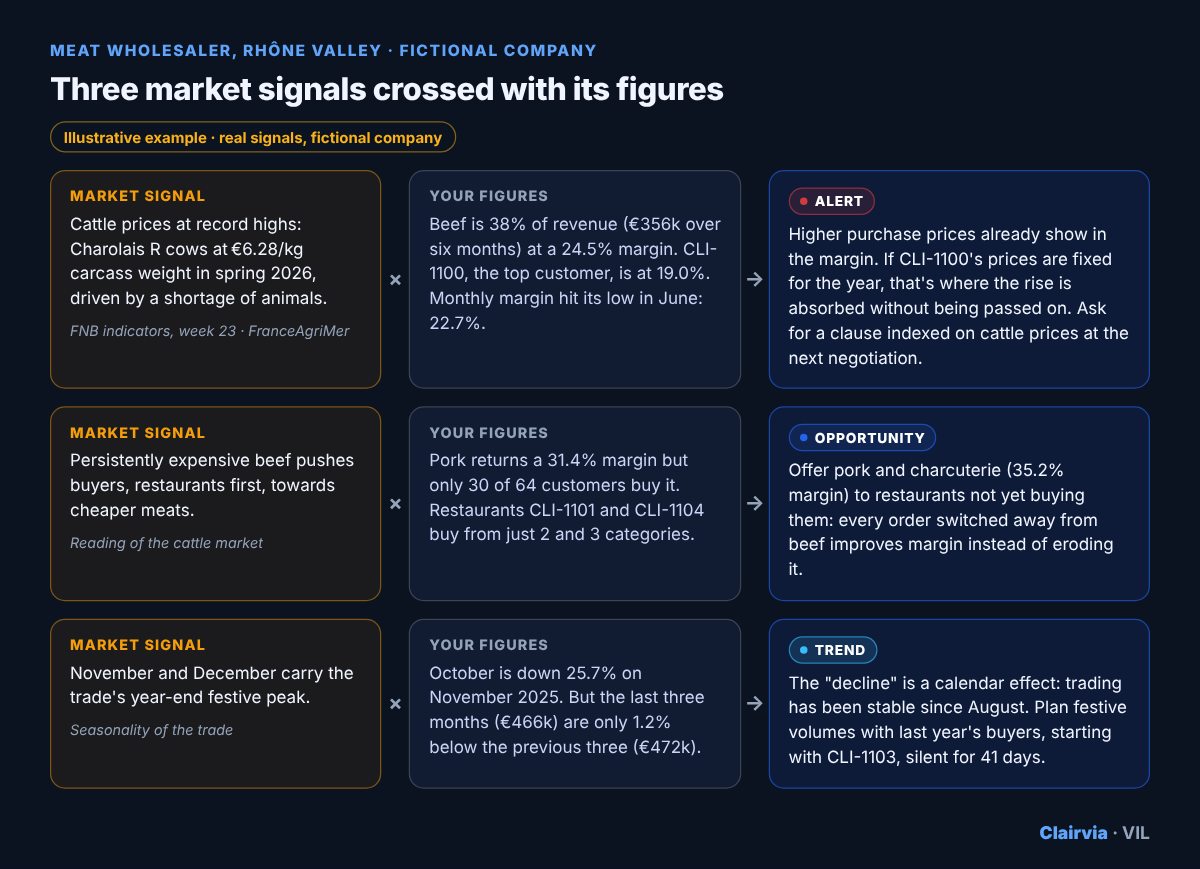
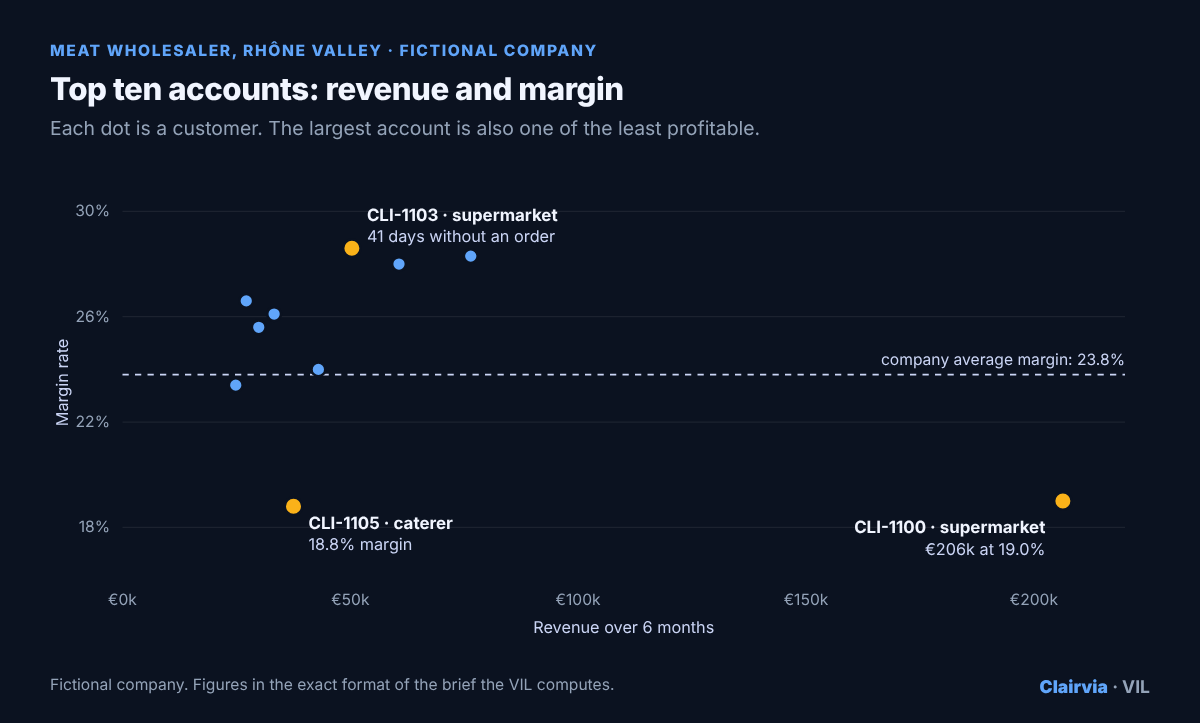
The price rise, read in one customer’s margin. Beef is 38% of revenue at a 24.5% margin, with a June low of 22.7%. CLI-1100, the largest customer at €206k over six months, sits at 19.0% against a 23.8% average: nearly €10k of margin lost. With prices fixed for the year, that’s where the rise is absorbed. The action: a clause indexed on cattle prices at the next negotiation.
The same signal, turned into an opportunity. Expensive beef pushes buyers, restaurants first, towards other meats. The wholesaler makes 31.4% on pork, yet only 30 of its 64 customers buy it; two top-ten restaurants buy from just two and three categories. Every order moved to pork or charcuterie (35.2%) lifts margin.
The trade’s calendar, against a false alarm. October is down 25.7% on November: alarming on the chart alone. But November and December carry the festive peak, and the last three months are only 1.2% below the previous three (€466k against €472k): stable since August. Rather than cut purchasing, plan festive volumes with customers, starting with CLI-1103, silent for 41 days.
Second example: a building firm facing the October 2026 outlook
Forty-two projects, seventeen live, nineteen clients — social landlords, councils, developers, property managers — €9.48M of revenue, a 35.4% gross margin: on its own figures, a healthy business. The market, as the French building federation (FFB) described it on 1 October 2026, less so:
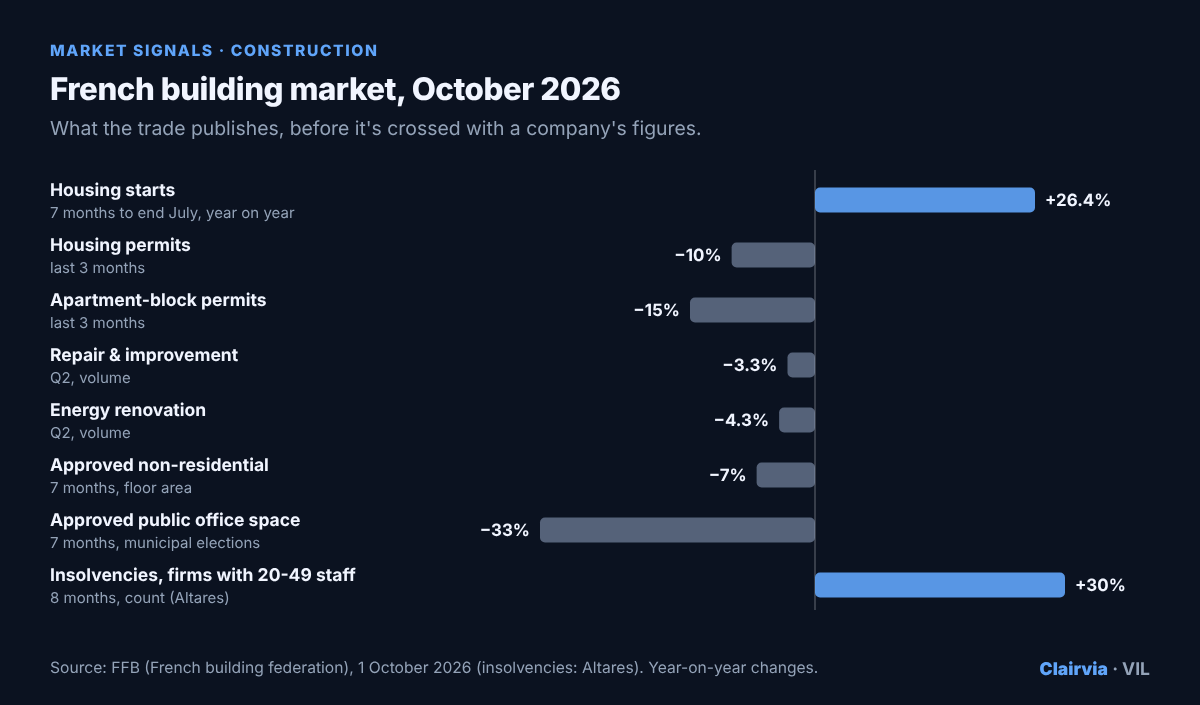
The note says the market is worsening, not what that changes for this firm. That’s the VIL’s job.
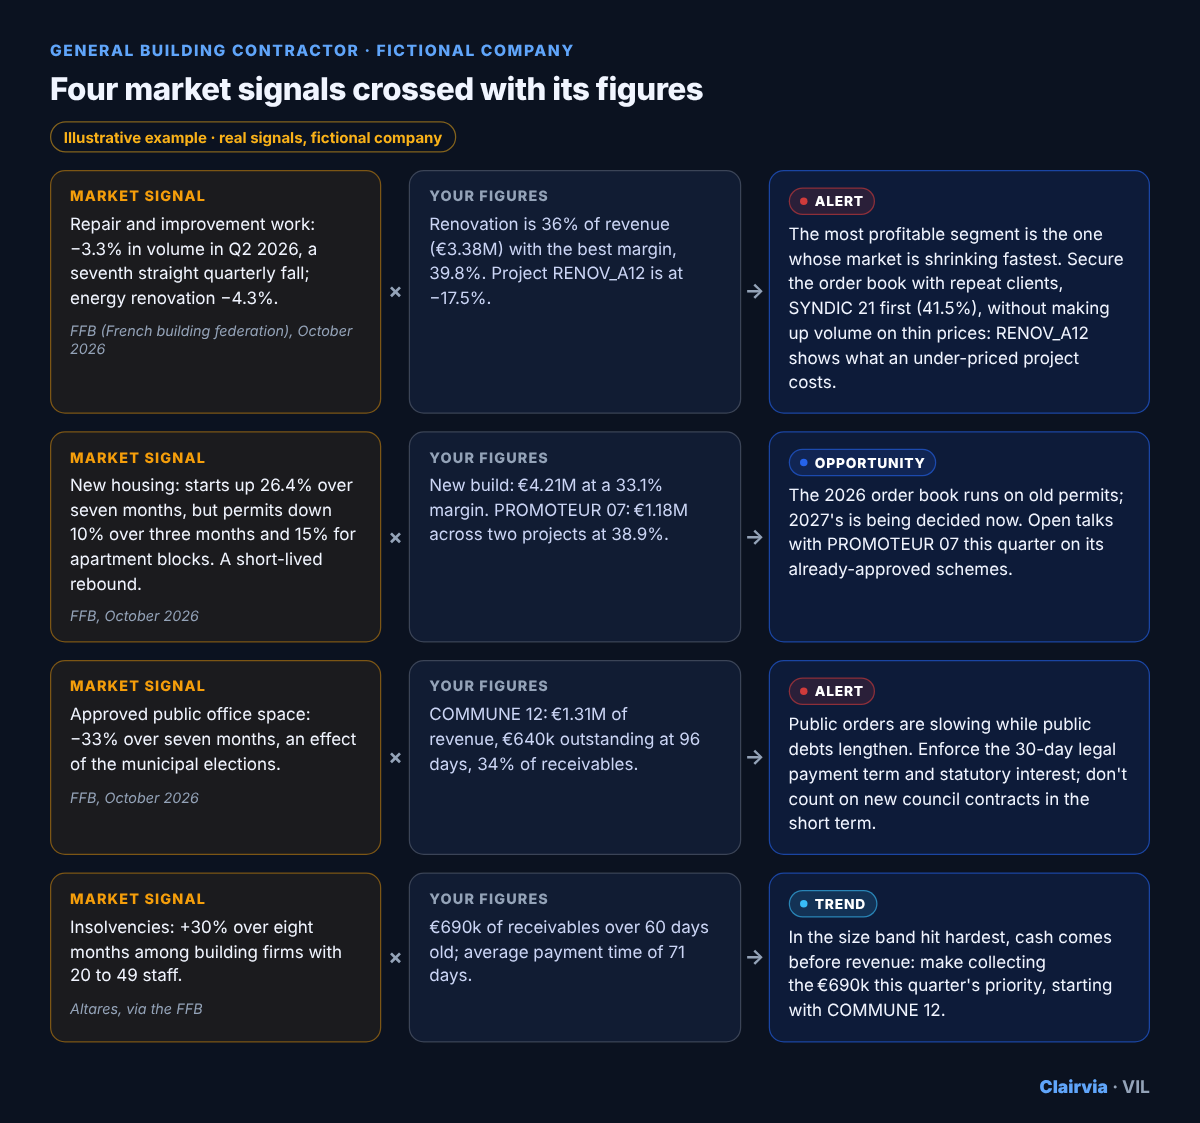
The most profitable segment is the one shrinking. Repair and improvement fell 3.3% in volume in the second quarter, the seventh fall in a row, and energy renovation 4.3%. Renovation is 36% of the firm’s revenue at its best margin, 39.8%. Chasing volume with thinner prices produced RENOV_A12, now at −17.5%. The VIL says the opposite: secure the order book with repeat clients, SYNDIC 21 first, at 41.5%.
The new-build rebound is already behind. Housing starts are up 26.4% over seven months, but permits are down 10% over three months and 15% for apartment blocks; the FFB calls the rebound short-lived. 2026 runs on old permits; 2027 is being decided now. PROMOTEUR 07, €1.18M at a 38.9% margin, is the client to see this quarter about its approved schemes.
The council elections, read in the receivables. Approved public office space is down by a third, an effect of the March municipal elections. COMMUNE 12 brings €1.31M of revenue and owes €640k at 96 days, 34% of receivables. Public orders slow while public debts lengthen: enforce the 30-day legal term and statutory interest, and don’t count on new council work.
Insolvencies, read in the cash position. Proceedings are up 30% over eight months among building firms with 20 to 49 staff. For a firm that size, with €690k of receivables over 60 days old and a 71-day average payment time, this quarter’s priority is cash, not revenue.
Why the crossing changes everything
No finding above comes from one source alone: the FFB’s note knows nothing about COMMUNE 12 or PROMOTEUR 07; the firm’s dashboard, nothing about permits or elections. The VIL holds both ends, under three rules:
- figures are computed before they’re commented on — the 38% beef share, the 34% of receivables, the 41 days without an order come from the database, not the model;
- every market signal is dated and sourced — a finding resting on a stale signal says so;
- the format is imposed — five findings at most, at least one alert, one opportunity and one trend or strength, each naming accounts, amounts and an action. That’s what keeps a firm green on its own figures from an all-green panel.
How it works: the introduction to the VIL.
Frequently asked questions
Which market signals does the VIL use? Federation outlooks, price quotations, trade press, sector news feeds and the trade’s benchmarks, each dated and sourced.
Do these two companies exist? No. They are fictional; the findings are examples in the VIL’s exact format. The market signals are real and sourced below.
Is my data mixed with other companies’ data? No. The market is shared across an industry; your data stays isolated per customer, hosted in France.
The most telling test: what the VIL draws from your own files, against your industry’s market — get in touch.
Sources for the market signals cited
- Fédération française du bâtiment, “Conjoncture Bâtiment”, 1 October 2026 (insolvencies: Altares).
- Fédération nationale bovine, price indicators, week 23 of 2026.
- Réussir, “Prix des gros bovins : où est le plafond ?” (FranceAgriMer quotations, shortage of animals).